Integrating the OKA Suite with your AWS cluster
Efficiently running an HPC infrastructure is complex, and often lacks the proper tools to track down and get insights on how the users are behaving and how the cluster is responding to the demand. This is even more complicated when using Cloud clusters. Due to their transient and dynamic nature, information about instances types, location and costs are important assets to monitor, especially when you pay for what you use. The task of managing and presenting these metrics becomes increasingly difficult when the scale of the infrastructure grows or undergoes changes over time, which is a common situation in Cloud environments.
“Standard” metrics and information provided by the job scheduler might not be sufficient to efficiently manage the Cloud clusters. For example, tracking the cost of running jobs becomes even more important in order to monitor and manage your budget, and redistribute the costs to your users/departments. Due to the wide variety of compute instance types in the cloud, it can also be interesting to track on which instance types the jobs have run, in order to check their performances and associated costs, and further improve the placement and instance selection of the jobs.
OKA offers many benefits to monitor your jobs, and deep-dive into how your clusters behave and how they are being used by your end-users. Accessing in OKA information about the cloud is straightforward, if you have configured your environment properly. In this article, we present a simple integration that can be made in a Slurm cluster in AWS to retrieve the type of instances jobs runs on, their pricing information (on-demand/spot, per hour price…), the AWS region, and virtually any information about the AWS environment you are using.
The scripts provided below are given as examples, and can easily be adapted to retrieve more detailed information, or be adapted to work with other job schedulers (e.g., LSF, PBS…).
There are many ways to create a cluster in AWS, the details are out of the scope of this article, but you can use for example AWS ParallelCluster or CCME.
Note: the solution presented here is extracted from CCME where it is available out of the box.
The principle depicted here is very simple, and relies on two components:
- A Slurm epilog script that will gather information about the AWS environment on which the job runs, and store this information as comma separated values (CSV) in the Comment field of the job. The gathered information are:
- instance type
- instance id of the “main” job node
- availability zone
- region
- instance price
- cost type: ondemand or spot
- tenancy: shared, reserved…
- An OKA Data Enhancer that will parse the values of the
Commentfield, and store them as additional information with each job.
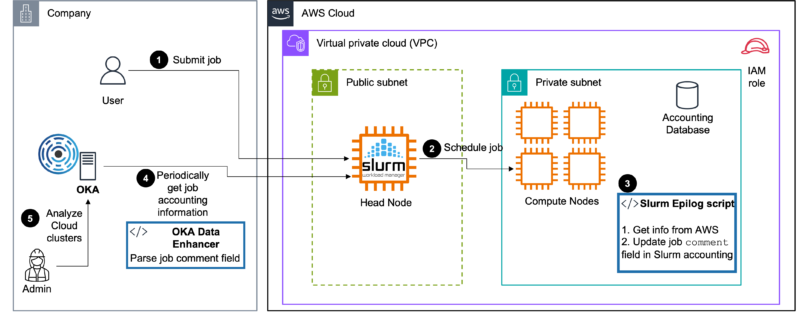

The principle depicted here can also easily adapted to other Cloud providers. For example, you could follow the indications presented in the Azure integration with Slurm presented here in the “Granular Cost Control” section.
Slurm epilog script
This Slurm epilog script retrieves information about the instance type and its pricing when the job ends,
and stores the information in the Comment field of the job in sacct. The user provided comments are kept, and the information are added at the end after a semicolon. The format of the Comment field is the following:
The following packages are required and should be available on all the nodes of the cluster:
Also note that this solution requires that Slurm has been configured to keep accounting information about the jobs. See Slurm documentation to configure accounting manually, or if you are using AWS ParallelCluster you can follow this guide.
As the epilog script contacts AWS APIs to gather the information, it needs to run on instances having (at least) the following policy attached to the role of the instance:
Script
Installation
- Copy the epilog script to a folder accessible on all nodes, e.g.,
/shared_nfs/slurm/slurm-epilog.sh, and give it execution rights:chmod +x /shared_nfs/slurm/slurm-epilog.sh - Edit
/etc/slurm/slurm.conf(on all nodes), and set theEpilogoption to/shared_nfs/slurm/slurm-epilog.sh - Reconfigure Slurm daemons:
scontrol reconfigure, or restart them:systemctl restart slurmd
Then submit a job. Once finished, check that in the output of sacct you have in the Comment field the expected output:
sacct --format "jobid,comment".
OKA Data Enhancer
A Data Enhancer needs to be created and configured in OKA in order to parse the additional data gathered by the Slurm Epilog script. We propose here an example Data Enhancer that you can adapt to your needs (included in comment is the generation of “fake” data if you wish to test it first):
Installation
Please refer to the Data Enhancer section for explanations on how to install and configure this Data Enhancer in the ingestion pipeline.
Accessing AWS information in OKA
The information ingested through the Data Enhancer are then available in OKA in multiple plugins and through the filters.
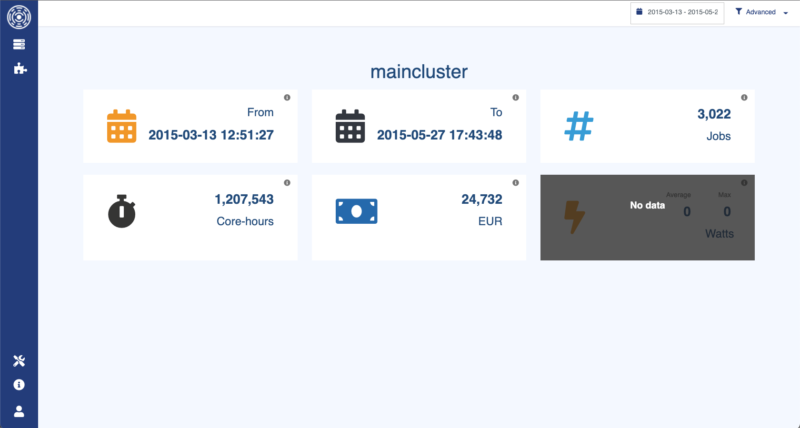
We present below a few examples of where the information can be accessed and used to analyze your workloads:

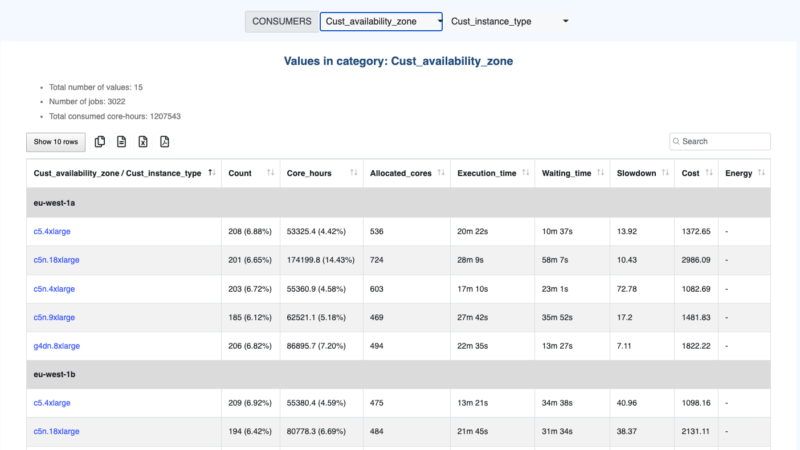

Detailed information in Plugin Consumers
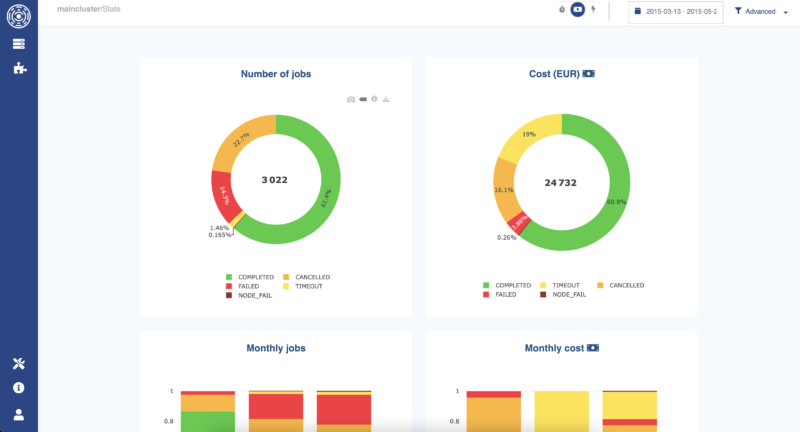

Cost per job status in Plugin State to detect waste.
Conclusion
This article presented a simple integration approach for a Slurm cluster in AWS. By leveraging a Slurm epilog script and an OKA Data Enhancer, valuable information about the AWS environment can be retrieved and analyzed.
By utilizing the integrated AWS information in OKA, administrators gain access to various plugins and filters for analyzing and visualizing workloads. This enables better cost management, granular control, and identification of wasteful practices.
Overall, the integration of an AWS cluster with OKA empowers administrators to optimize their HPC infrastructure, gain insights into resource utilization and costs, and make data-driven decisions for efficient cluster management in cloud environments.


